(14 August 2017)
"Convergence" of these models has now been tested.
If you want to know about stress concentrations around
Jumping straight to the findings: graph of outcomes , as a "PDF".
Back when I did these original simulations in May 2016, it was early in "playing with" Finite Element Analysis modelling, finding whether I could make it work for me with practicable effort (yes), using the "restricted" "free trial" version of LisaFEA.
A recent query came to me about a completely different matter, but
involving stress concentrations at geometric features.
The quickest way to illustrate the concepts for that case was to
re-run these simulations at increasing refinements, and show their
outcomes.
This allowed me to inspect an assertion.
For sharp stress-raising features which are of paramound engineering
interest, if you Finite Element model them, the stress gets ever
higher with increasing discretisation / mesh-refinement. That is,
there is never "convergence". The answers do not get more similar
with increasing refinement, clearly coming to a final single constant
answer.
That is
The new treatment of these models, applying mesh refinement seeking convergence, is presented here: fillet-weld toe-geometry simulations with increasing mesh refinement .
Re-interpret the Section "Comment on what the models show" given above information...
The "weld toe" is where the outer face of the weld deposit meets the metal being welded. This is general to all welds. Fillet welds are described eg on Wikipedia , where the weld toe is labelled. The form of fillet welds is well presented by The Welding Institute (UK) - which mentions weld toe but does not label it.
Welds typically suffer a very low fatigue endurance - way below what a
piece of metal with no welds on it would offer.
The dominating explanation was identified in 1967 [Signes, Baker,
Harrison and Burdekin]. The edges of welds - the weld toes - have
unfortunate fine-scale crack-like features, right at the point where
the change-of-section, the shape discontinuity of the weld, is causing
a stress intensification.
These toe-intrusions comprise both cold-laps over the "parent plate",
plus slag inclusions in the metal at the weld edge
(conjectured to be caused by the coolness near freezing point of the
weld-pool at the weld edge, causing slag inclusions to freeze in place
in the "pasty" metal rather than be swept clear and ultimately rise to
the weld pool surface as slag).
Toe intrusions of laps and slag inclusions with associated fatigue-cracking, identical to those shown in the Signes Baker Harrison Burdekin 1967 publication, can be seen in my work of 2011, for "standard" welding conditions.
"T" (shaped) fillet welds have particularly low fatigue endurance due to the geometric stress intensification factor of going from the parallel plate to the rising weld reaching to the side-attaching plate.
I found the 1967 Signes Baker Harrison Burdekin work when investigating why it did not always have to be so that welds had low fatigue endurance. As I was finding in my weld-and-fatigue tests.
My objectives for weld-toe situations modelled by FEA simulation were:
The shapes representing the three conditions will be seen in the FEA simulation programme outputs.
The FEA solutions are 2-D, declaring (enforcing) plane-strain.
That is a perfect match for these simulations, as welds are long
compared to the cross-section. Leaving computing resources free to
discretise the cross-section well with a fine mesh. Particularly with
local refinement in the region representing the weld toe.
The modelled plate upon which the fillet weld is made is 16mm thickness. Given the model has 8mm thickness from the plane-of-symmetry.
The shape of the object simulated is simplified, compared to a real
T-fillet weld. The stress-field around the weld toe is a local
phenomenon, so any model which passes realistic conditions to that
studied region is good.
Plenty enough of the weld fillet height is represented in the solution
to enable stresses to "flow" as they would beyond the weld toe, into
the weld fillet.
The material properties of steel have been represented in the model:
200GPa Young's (elastic) modulus and Poisson's Ratio of 0.3.
Stating what has previously been implicit: the plate metal and weld
metal have identical properties in the model, as "steel". Forming a
single object of homogenous isotropic properties; whose shape and
applied-loading-state determine all variations investigated. In a
linear-elastic model, this homogenous property of elastic modulus and
Poisson's Ratio is realistic.
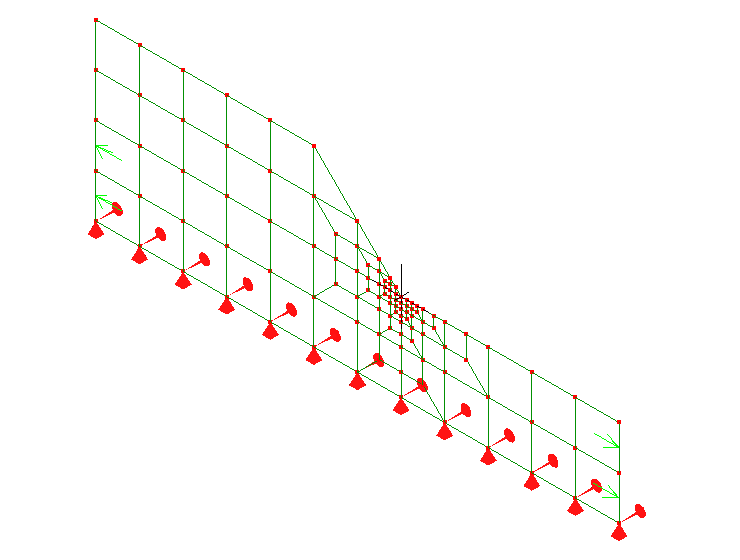
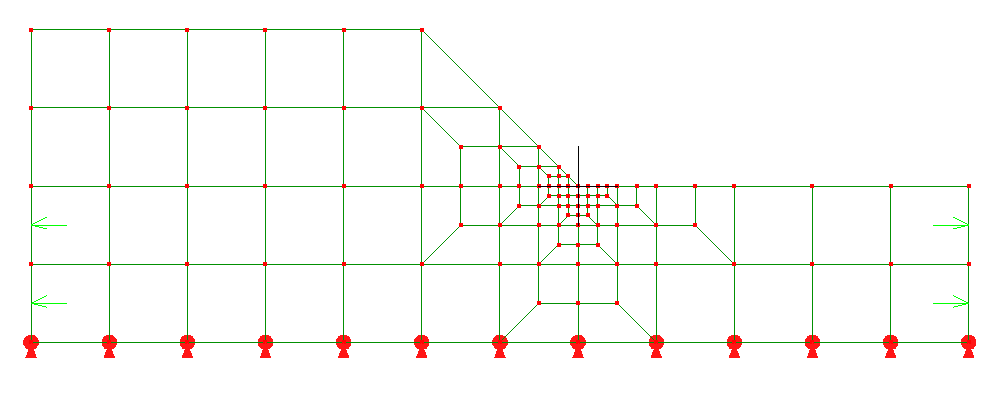
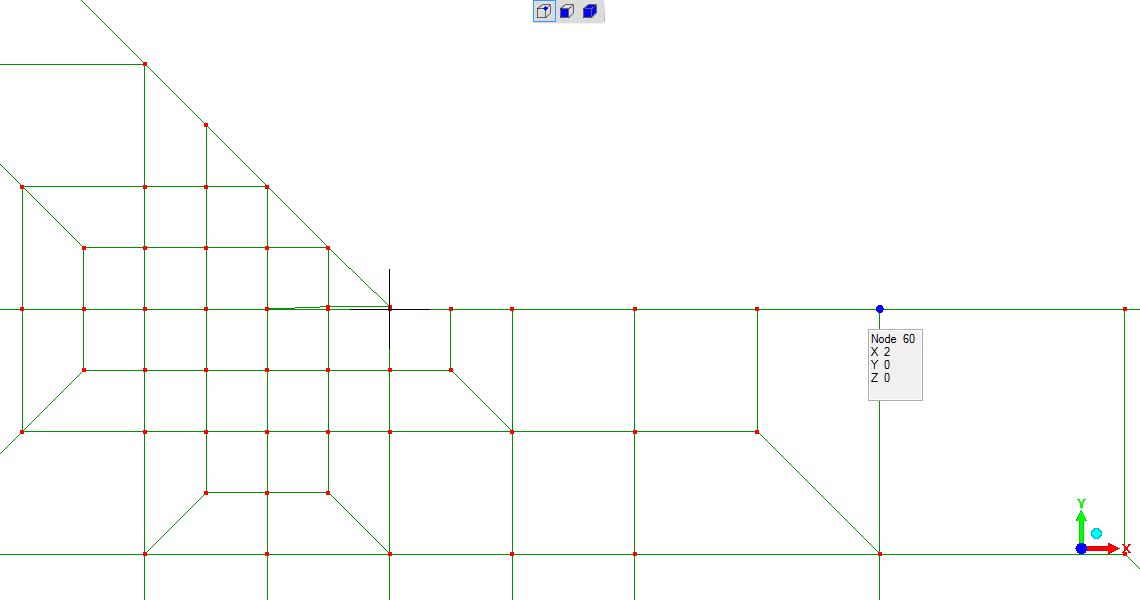
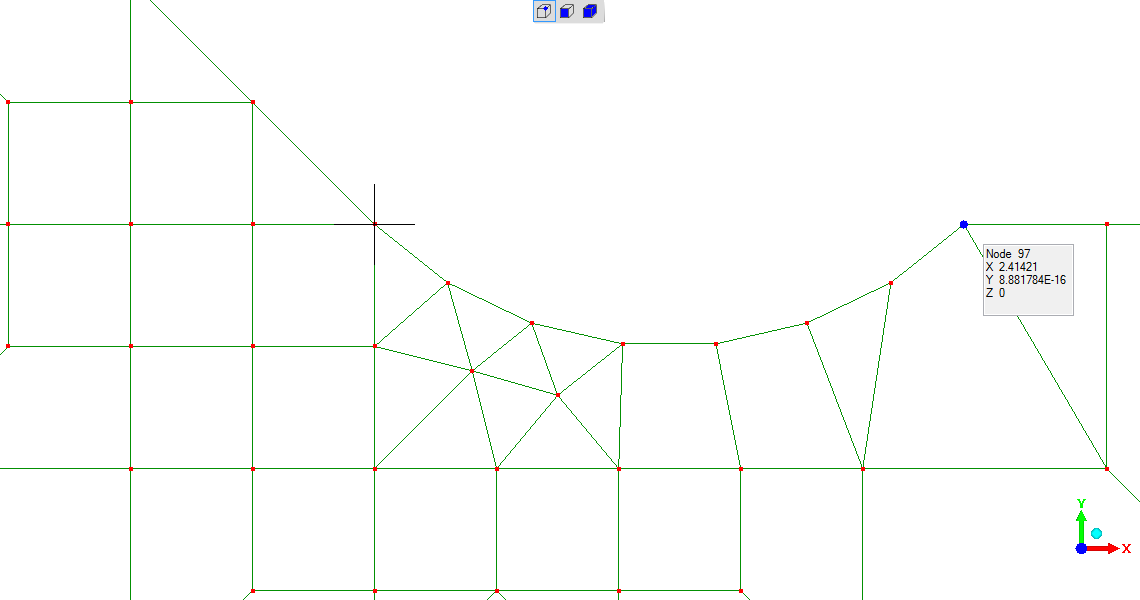
The mesh shown is for the "blueprint" case.
For the other two cases, the overall mesh is the same. The local mesh
modification to represent "toe intrusion" and "toe-groove" is to be
seen in the subsections for those simulations.
The model applies a plane-of-symmetry in the "horizontal" "XZ" plane
of the represented shape
(the "XZ" plane's dimensions are left/right and in/out of the plane of
this screen in all these models).
This is seen in the "zero Z displacement" and "zero Z-axis moment"
constraints placed along the lower edge of the mesh in these two
images of the same mesh. These are represented by the red
"cone-shaped" and "trumpet-shaped" markings, respectively.
Applied loads are shown by the green arrows, seen at the
left-hand-side and right-hand-side ends of the mesh.
Applying the plane of symmetry enables modelling only half the weld;
where in this case I have chosen to model only the half above the
continuing plate's central plane (more loosely; "centre-line").
The geometry and stress-states are identical about the plate's central
plane; giving a balanced symmetrical response to the stress-state in
each half. That balance makes the "zero Z displacement and zero
Z-axis moment" correctly characterise the plate's central plane.
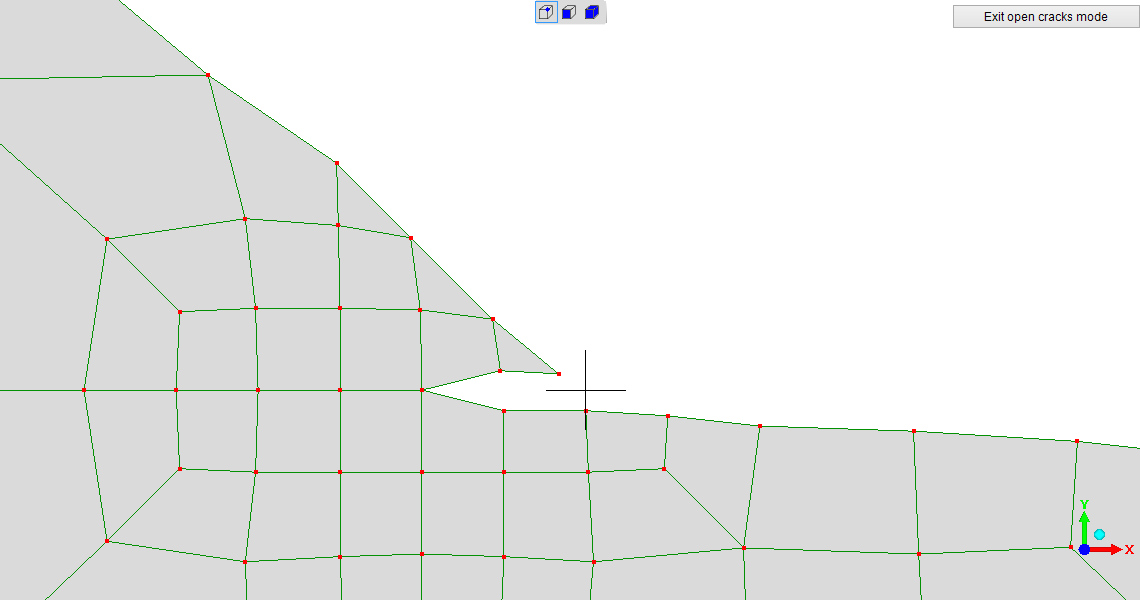
The mesh concentrates via local refinement on the represented weld toes.
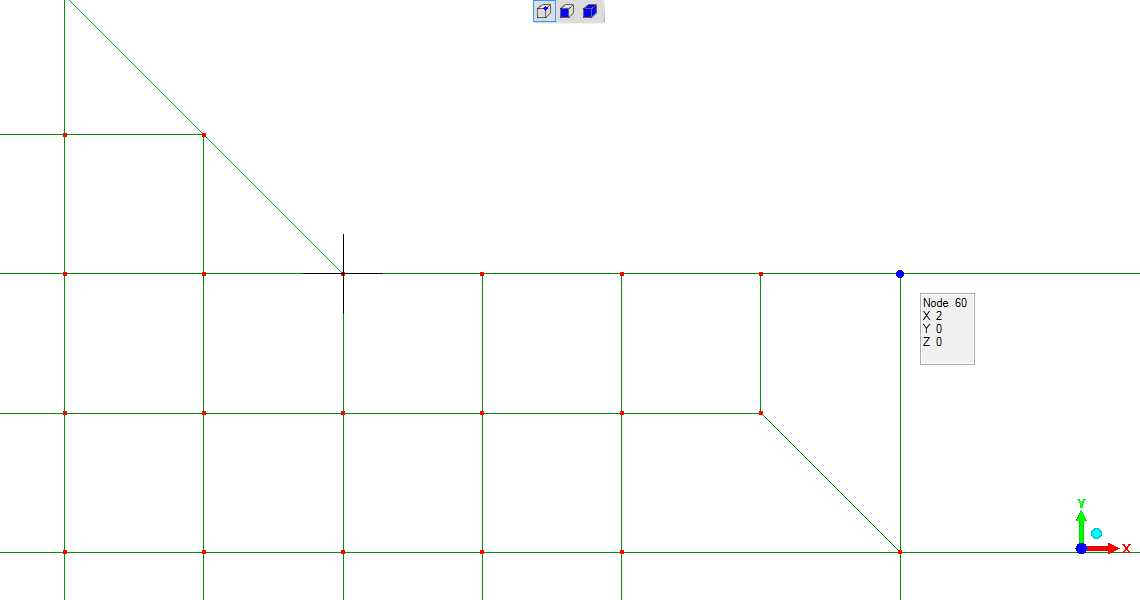
The images for each model are obtained at the same "zoom" - they
show identically the same region.
Comparing between models, the "zoom" is about the same. That can be
verified from the displayed coordinates of the highlighted node in the
mesh view, which is around 2mm from the fillet-weld toe (there isn't a
node at (2,0,0) for the "toe-groove" simulation - the next available
node on the (x,0,0) plane is "Node 97" at (2.414,0,0)).
The modelled plate is 16mm thickness, as previously mentioned.
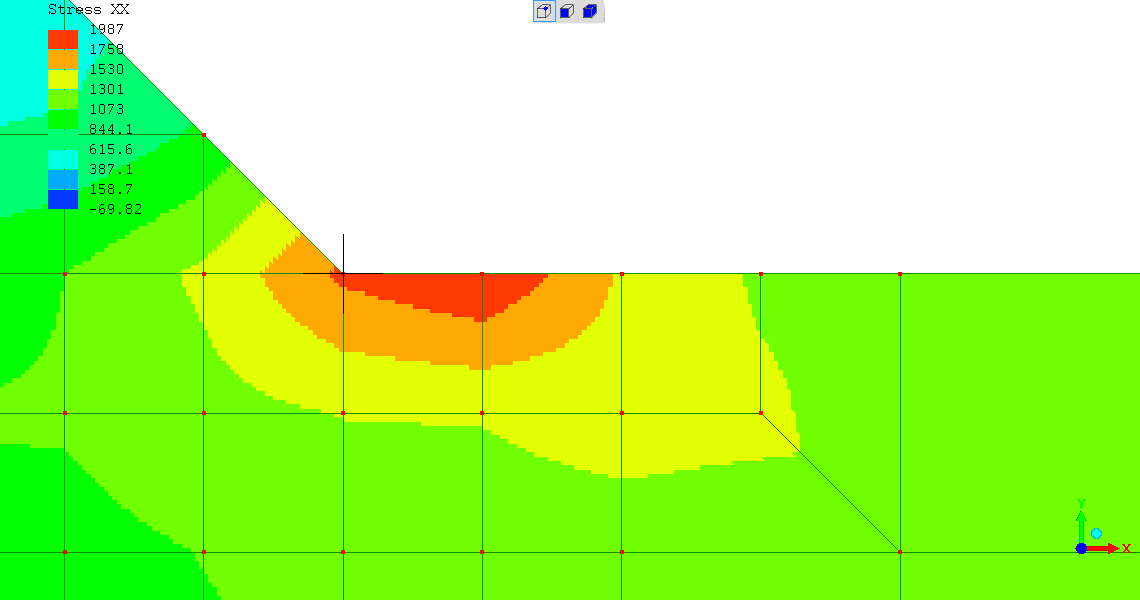
The applied stress in the "parent plate" - the represented plate to
the right-hand-side is always "1000". Therefore the stress intensity
can be evaluated by dividing the displayed stress by 1000.
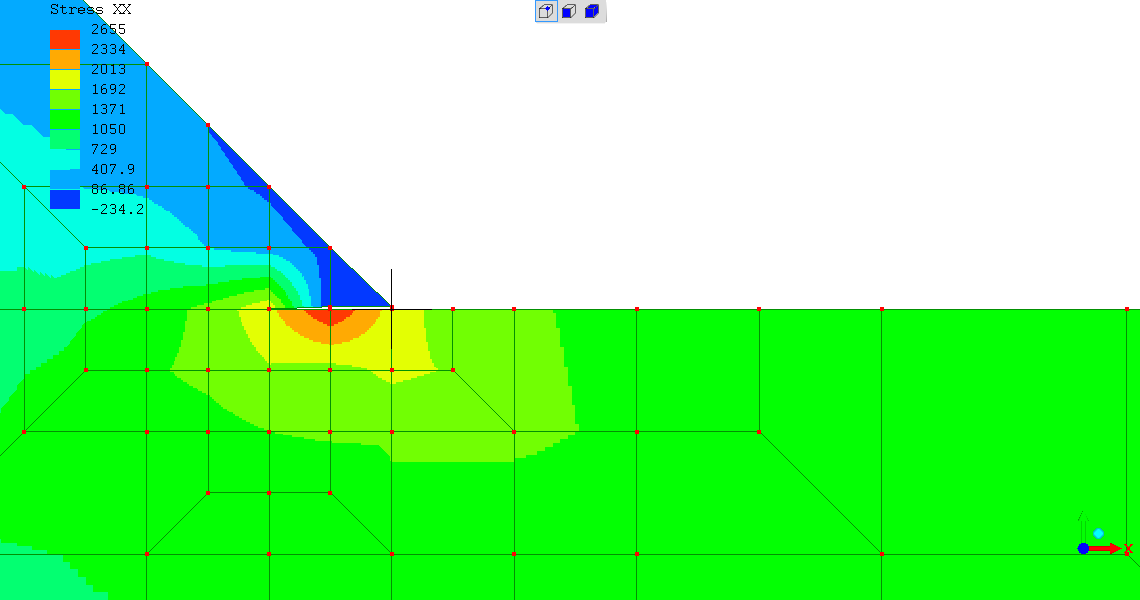
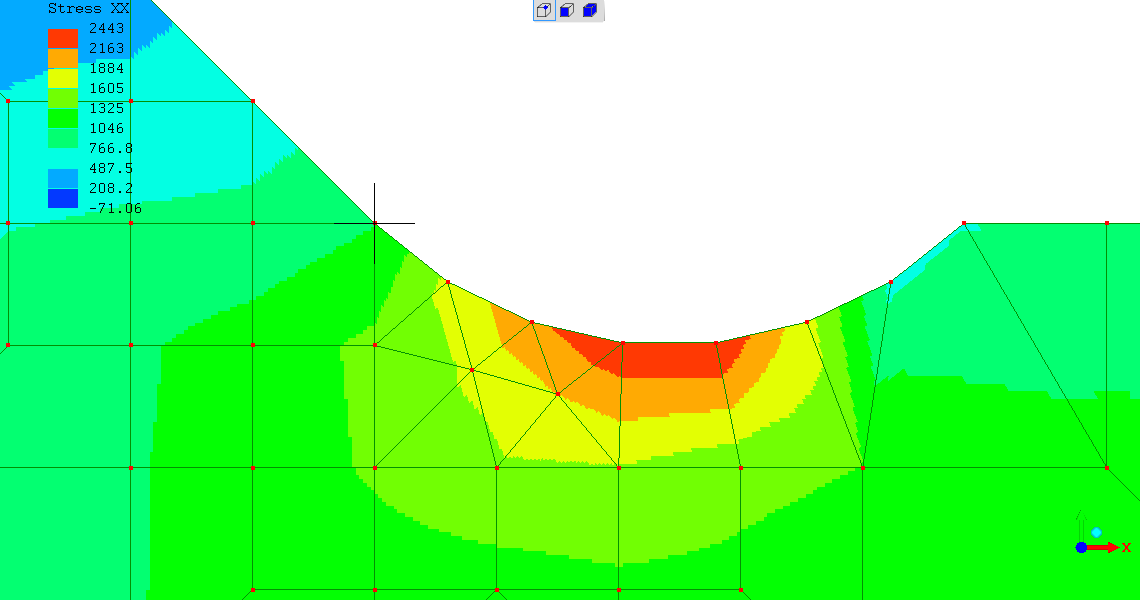
eg, for the first of the three cases shown, the "as-blueprint"
case; the highest stress intensity for the "Stress XX" case is 1.987X
the ruling stress in the plate (1987/1000), which is seen just to the
plate side of the weld toe. Please be aware that these solutions are
inherently approximate - so it would be reasonable to say the highest
stress intensity is "about 2.0 times the force/area stress in the
plate".
The three models are each present the order
PLEASE NOTE - I have not convergence-tested these models (yet!), nor had them peer-reviewed - so they should not be taken as authoritative.
Subject to this caveat - any comment about what the simulations might show is in a final subsection after the three individual modelled cases are shown.
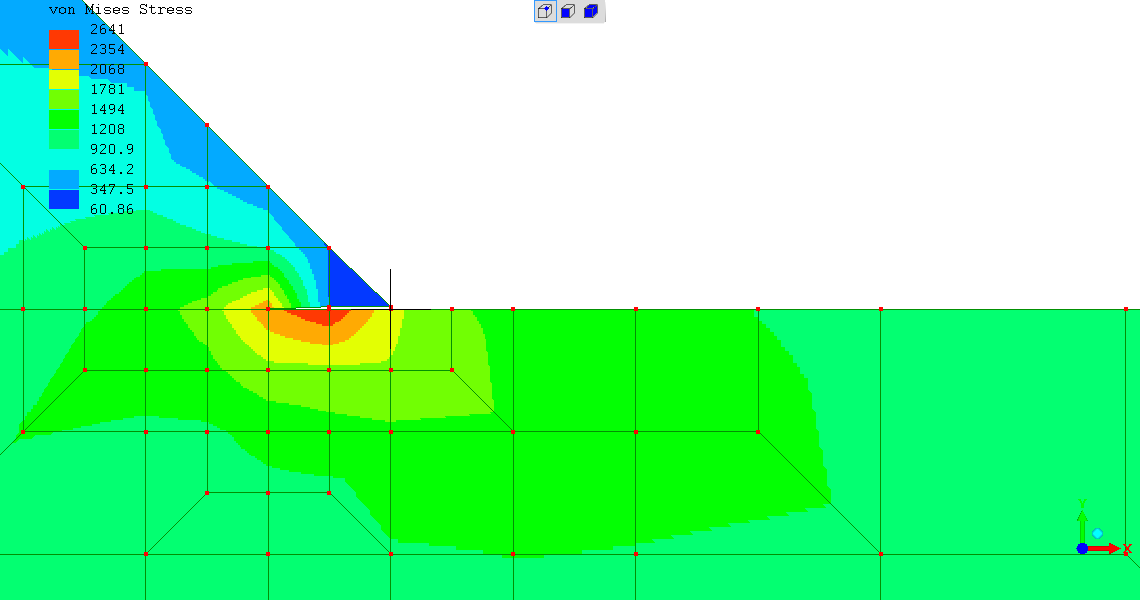
This is the as-designed case. As if the weld had a perfect 45degree mitre and a flawless intersection, otherwise featureless, with the plate metal being welded.
Thus, it is the reference case.
The toe-intrusion is modelled as a 0.5mm long sharp-tipped crack, intruding along the plane of the surface of the plate, at the weld toe.
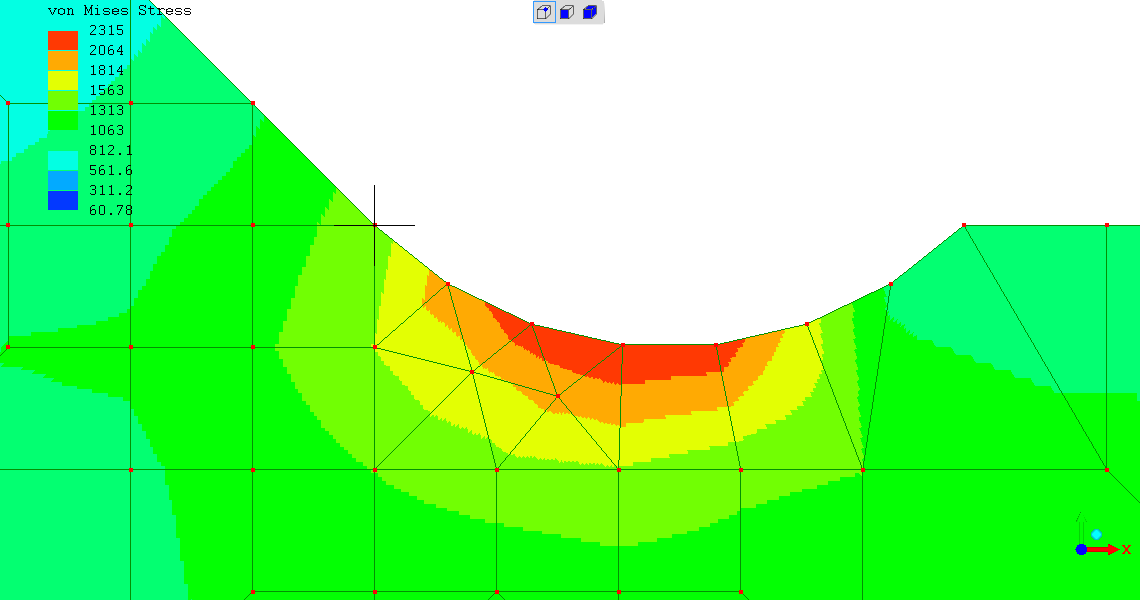
Toe-groove is modelled as being 0.5mm deep.
Its form is semi-circular radius. It transitions into the weld bevel
at the 45degree bevel angle, at the plane of the plate surface. With
these geometric constraints, this results in a toe-groove which is
2.4mm wide (reasonably realistic for such a deep obvious toe-groove).
Subject to the previously mentioned caveat that I have not convergence-tested these models (yet!) nor had them peer-reviewed - so any comment must be tentative...
So far these simulations do not show a big reason why in real life welds with toe-groove can have very high fatigue-endurance several times higher than expected - whereas representative real welds with toe-intrusions have the reference familiar low fatigue-endurance.
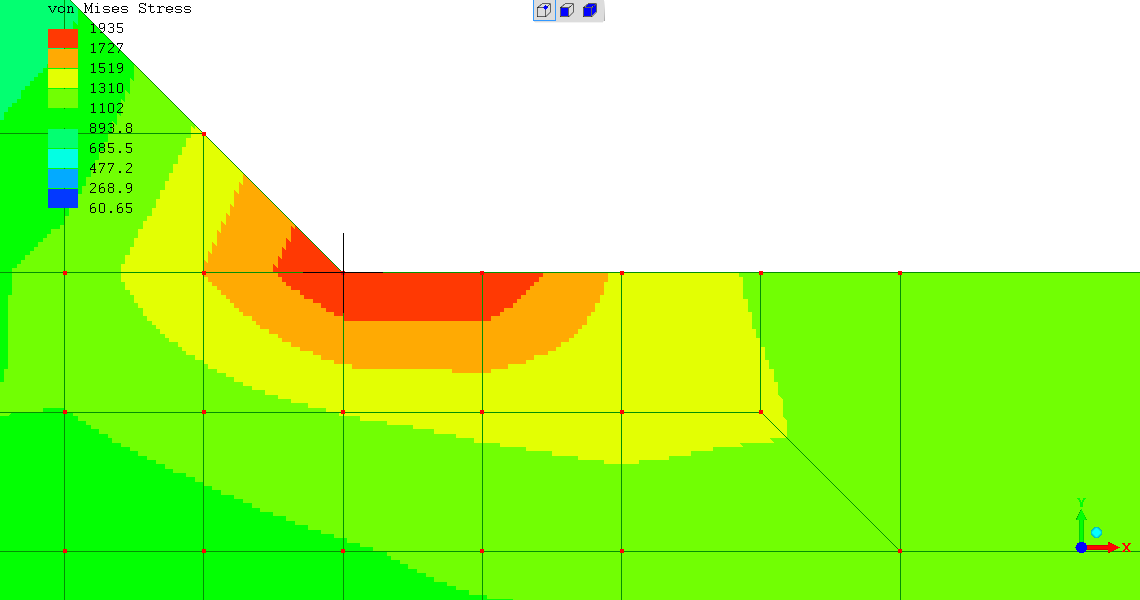
Considering von Mises (deviatoric) stress; the maximum stress intensities shown, all in the weld-toe region, are:
Setting aside the impartial scientist and engineer personality; one feels gratified that the crack-like toe-intrusion case has the highest stress intensity factor, but feel disappointed that the semi-circular toe-groove does not have the lowest stress intensity factor.
It is commonly commented about FEA that when modelling a sharp feature, the finer the mesh the higher the maximum stress intensity (it doesn't really converge well).
Stress intensities around specific local features are best evaluated
according to mathematical formulae derived for these cases. Noting
all work on the "Stress Intensity Factor", often given the symbol "K"
in engineering literature.
For real engineering structures with complex geometries leading to
stresses which can only be quantitatively evaluated by computational
modeling, the "Stress Intensity Factor" is being applied upon a
realistic regional stress level indicated by the FEA model (???).
In these models I've "cheated" - I've made the regional stress obvious
and so easy to immediately calculate that it can be done by mental
arithmetic - as the force/area stress, with forces and areas chosen to
give simple numbers (stress of "1000", etc).
But that has not overcome that local stress-intensifying features are
not trivially modelled (???).
So the final note is - enjoy the pictures, but leave alone any attempt to read value into them :-)
(14Aug2017 - per re-evaluation with increasing mesh-refinement - there is significant value in these simulations and their findings are known to accord with known physical / real-world behaviour)
(R. Smith, 17May2016, 14Aug2017)