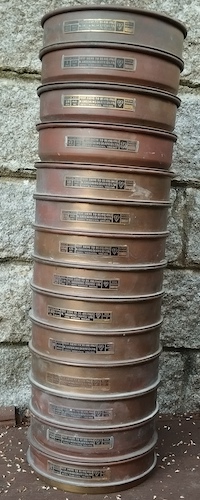
With this stack of sieves
I did a sieve analysis as the Particle Size Analysis on an early test grind done in my rod-mill [video on my YouTube channel].
The rod-mill batch charge of 10mm granite chippings are what would be used to surface a pathway. This serves as a useful "test" and "reference" feed to investigate the mill performance.
The reason for wanting to get a Particle Size Analysis on this grind
is that it was so wrong.
Seeking to suppress dust-formation (that was achieved!), I fed the
granite chippings to the mill wet, giving a damp ground product.
The comminute, damp, "caked" around the periphery of the rod-mill shell,
giving a "nonsense" inhomogenous grind.
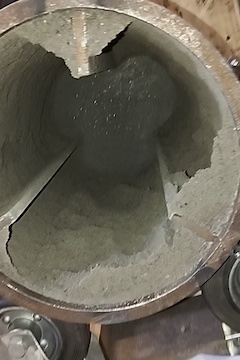
Hence - interesting case to do a particle size analysis on.
Likely to throw challenges broadening the learning of sieve analysis.
I wet-sieved to eliminate dust-formation.
The separation into sieve sizes is seen here:
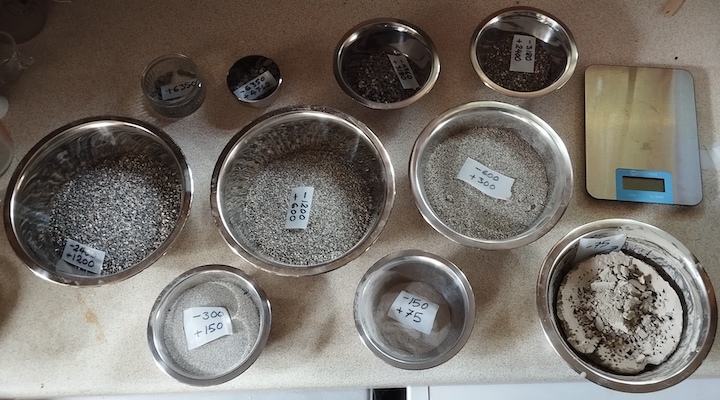
The sub-sieve very-fines (lower right-hand-side) have cemented together as a clay would in drying.
The sieve-sizes used were, in microns (micro-metres):
6350
4760
3180
2400
1200
600
300
150
75
The masses on each sieve were:
Aperture mass(gr)
6350	21
4760	42
3180	116
2400	141
1200	932
600	774
300	787
150	346
75	111
-75	615
By arithmetic (addition) - the sum total of these masses is 3885 g (3.885 kg)
Amount on each sieve - and finally the "sub-sieve" beneath the smallest aperture sieve - expressed as a percentage of the total mass...
A data "nonsense" I rectified in the presentation : the sieve series
is predominantly a geometric progression of halving size.
However, 6350microns and 3180microns are misfits in that series.
This
This was rectified by adding the "6350microns" mass to the 4760microns mass, and likewise the "3180microns" mass to the 2400microns mass - and not plotting the 6350micron and 3180micron points.
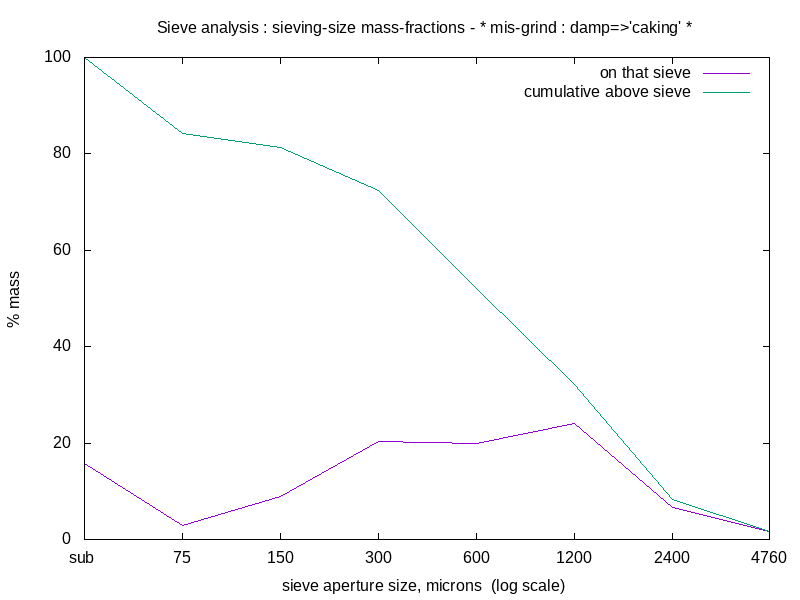
Hence the data plotted - aperture-size (microns) and mass (kg) - was
4760	0.063
2400	0.257
1200	0.932
600	0.774
300	0.787
150	0.346
75	0.111
37.5	0.615
These sum to the same 3.885 kg, obviously.
Quantitative classification as presented in the graph of the sieve analysis supports the immediate impression that particle sizes "are all over the place".
Pleasing result in many ways for a first effort at sieve analysis.
(R. Smith, 09Jul2025, 10Jul2025 (cake; obsns))